Graph depicting Change in Debt as a Percentage of GDP by President
share on facebook
 
share on pinterest
 
share on twitter
 
share on reddit
 
share on tumblr
 
share on google+


< Previous Graph Next Graph >


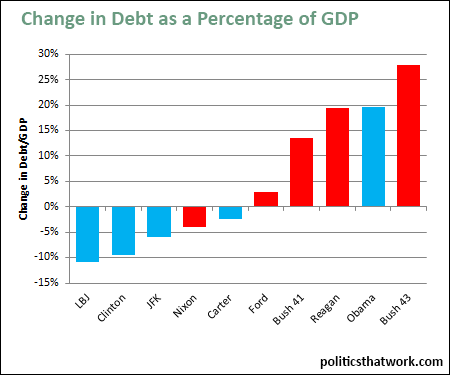
Description: This chart shows the change in the national debt as a percentage of GDP for each president after Eisenhower. The debt figures are taken from the end of the fiscal year in which each president was sworn in and the end of the last fiscal year during which each president served in office.

Sources: BEA   Treasury

Data: Excel

Last updated: September 29, 2016


Change in Debt as a Percentage of GDP by President


Discussion: Republican presidents after Eisenhower have increased the federal debt as a percentage of gross domestic product by a total of 60%. Democratic presidents have reduced the debt as a percentage of GDP by a total of 9%.

President Obama is the only Democratic President during whose time in office the debt has risen relative to GDP. The data extends to the end of FY2014 (September 2014). President Obama's bar will almost certainly drop by the end of his presidency, as GDP growth is relatively high and the deficit is relatively low. 2/5ths of the increase during President Obama's presidency occurred during the first year while the country was still in the midst of the Great Recession.

In terms of the change in the debt to GDP ratio per year, each Republican has performed worse than the previous Republican president. George H.W. Bush increased the debt as a percentage of GDP by almost 14%, which would have put him just barely behind his son had that continued for a second term.

Generally speaking, with the dramatic exception of President Clinton, earlier presidents have tended to perform better and more recent presidents have tended to perform less well. This is because GDP growth and taxes both tended to be higher in the earlier years of this range than they have been in recent years.

You can see the results when you include control of the legislature here. This data is also supported by research conducted by zFacts.


See more graphs about: Debt   GDP  


comments powered by Disqus