Change in Debt as a Percentage of GDP by the Party Controlling the Federal Government
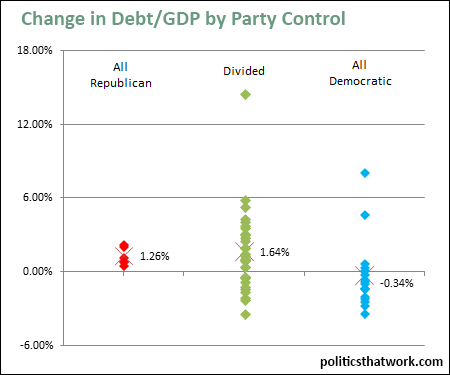
Description: This graph shows the change in the national debt as a percentage of GDP for years in which the Republicans have controlled both houses of the legislature and the executive branch, years in which the parties have split control, and years in which the Democrats have controlled all three since 1961. Each dot represents one year and the X marks and numbers are the averages for each group.
Discussion: On average, the debt has dropped 0.34% relative to gross domestic product during each year when the Democrats have controlled both the legislative and executive branch, it has increased by 1.26% when the Republicans have controlled both, and it has increased by 1.65% when control has been divided.
We should be somewhat cautious about relying too heavily on the "All Republican" number as there have only been six years since 1961 when the Republicans had control of both the legislature and the executive branch, but it is worth noting that the federal debt has never gone down relative to GDP during an all Republican year.
You can see the results by president here.See more graphs about: Debt GDP