Comparing How the States Treat the Poor
      | |
Scoring the States' Poverty PoliciesLooking at the amount the states spend on the safety net together with how regressively the state taxes gives a clear picture of which states help the poor get back on their feet and which states don't: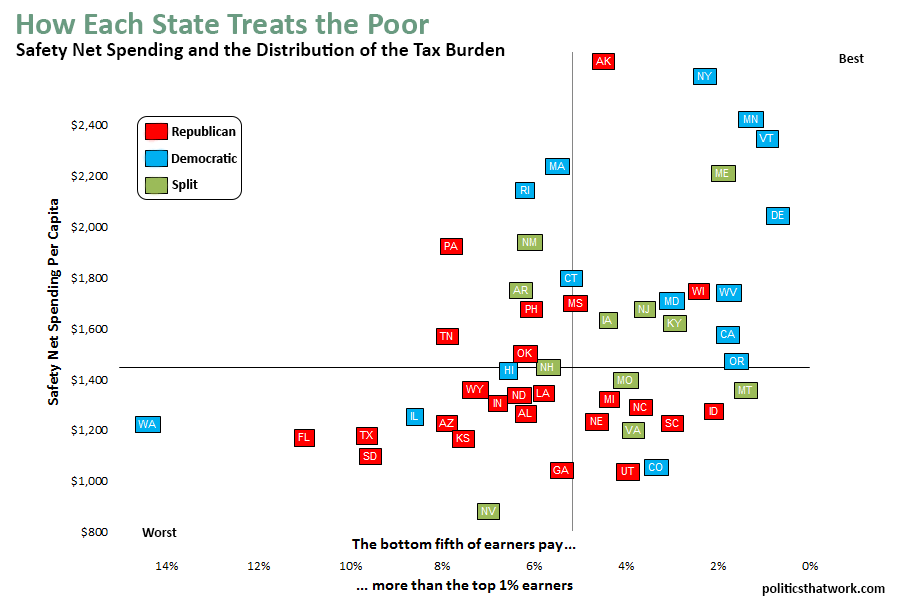
Sources: Census ITEP | Data: Excel The further a state is to the left in this graph, the more regressive its tax system is. Bizarrely, all states tax regressively, meaning that the poorer you are, the more of your income goes to state taxes in every state. In the most regressive state (Washington), people in the bottom quintile pay 16.8% of their income to state taxes, but people in the top one percent pay only 2.4% of their income to state taxes. The higher a state is on the graph, the more it spends on the safety net. The crosshairs represent the medians. States in the top right corner are better to the poor- the poor shoulder less of the states' tax burden and get more benefit from the state. States in the bottom left corner take a lot from the poor in taxes and give the poor little back. Red squares represent states in which the Republicans control both the state legislature and the governorship, blue squares indicate that the Democrats control both, and green squares indicate that each party controls at least part of the legislature or the governorship in that state. There is a clear tendency for Republican controlled states to treat the poor more harshly than states controlled by the Democrats do: 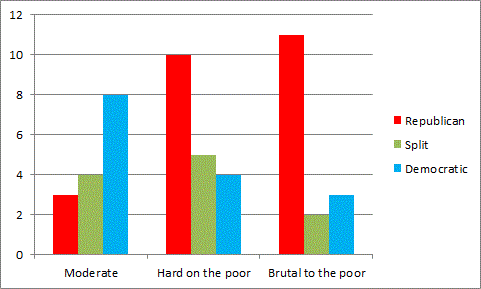
"Moderate" indicates that the state is in the top right corner, "Hard on the poor" indicates the top left and bottom right corners, and "brutal to the poor" indicates that the state is in the bottom left corner. However, it is important to note that none of the states have policies that are particularly generous to the poor. Even the liberal states in the very top right corner still spend less of their GDP on the safety net than many European countries and still tax the poor more heavily than they tax the wealthy. And, three liberal states find themselves among the states that treat the poor in an especially unfair manner. Washington state in particular stands out for having both a thin safety net and the most brutally regressive tax system of any state. How a state treats its poor has a significant impact on how much poverty there is in that state. Poverty in AmericaPoverty is an extremely serious problem in the United States. In 2013, 14.5% of the population of the United States lived in poverty. That represents 45 million Americans. 15.5% of part time workers and 4.2% of full time workers live in poverty. Poverty is even more common among children: 1 in 5 children lives in poverty. The United States ranks second to worst among developed nations for its child poverty rate and among the worst for poverty generally. This is largely because the United States spends considerably less of its GDP on the safety net than other developed countries and has drastic income inequality.14.3% of U.S. households are rated as "food insecure," meaning that at some time during the year, they experienced difficulty procuring sufficient food for financial reasons. 5.6% of households are rated as "very low food security," meaning that the household is unable to consistently maintain normal eating patterns and was forced to reduce caloric intake for financial reasons for at least part of the year. The national poverty rate has remained relatively constant since the late 1960s: 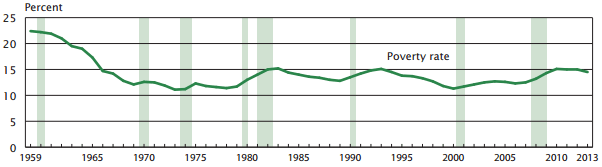
However, the level of poverty differs dramatically between the states: 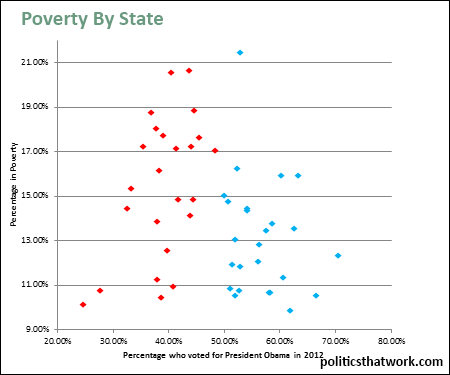
(click on graph for more detail and the source data) In the states with the least poverty (Utah, Vermont and New Hampshire), only 8% or 9% of the population is in poverty. Meanwhile, in the states with the most poverty (Mississippi, New Mexico, Arizona and Kentucky), 20% to 22% of the population is in poverty. There are many reasons that poverty differs so greatly between states, but among those reasons are state policies that create or reduce poverty. This article examines three such policies- welfare spending, education spending and regressive taxation. Welfare SpendingCash assistance payments issued by states range from a low of $5/year per person living in the state (Arkansas) up to $233/year (Maryland). Cash assistance payments include state expenditures on SSI, TANF, Medicaid and various state programs providing cash benefits to people living in poverty. The amount that states spend on cash assistance correlates strongly with the number of people living in poverty in the state: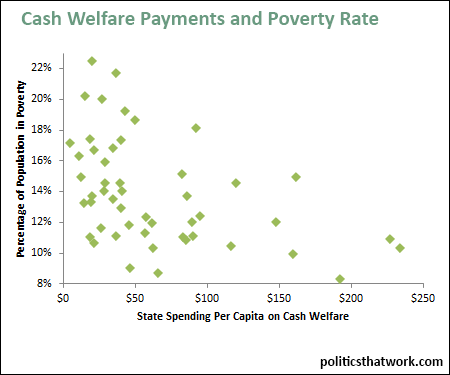
(click on graph for more detail and the source data) Education SpendingEducation spending per student also varies dramatically from state to state. Nevada, Utah, Idaho, North Carolina, Tennessee and Oklahoma each spend less than $9,000 a year per student on K-12 education while New Jersey, Alaska, New York, Wyoming and Vermont each spend more than $18,000. The level of education spending correlates strongly to the poverty rate as well: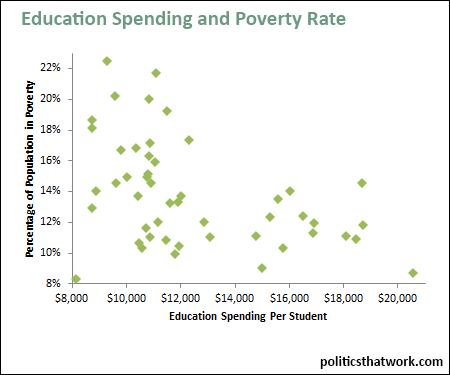
(click on graph for more detail and the source data) Regressive TaxationAll 50 states tax regressively- meaning that they take a larger portion of the income of the poor in taxes than they take from the better-off. But, some states have tax systems that are far more regressive than others. For example, in the most regressive states (Washington state and Florida), the bottom 20% pay 14% and 11% more respectively of their income to state taxes than the top 1% do, where in the least regressive states (Delaware, Vermont and Minnesota) the bottom 20% pay only around 1% more of their income to taxes than the top 1% do. Regressive taxation also correlates to higher poverty rates: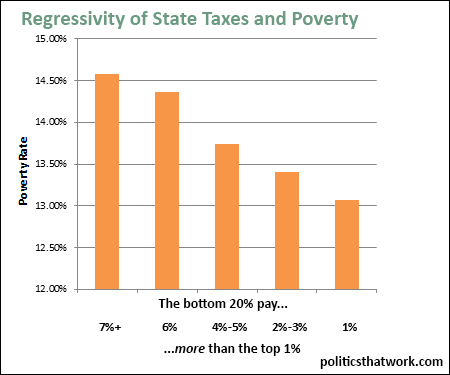
(click on graph for more detail and the source data) You can read more about economic inequality at the national level on this site's post on inequality in America or by picking up any or all of the following books: Thomas Piketty's Capital, Joseph Stiglitz's The Price of Inequality and David Cay Johnston's Divided: The Perils of Our Growing Inequality. April 15, 2015 | |
| |