 Sources: BEAData: ExcelStatistics:
 Two-tailed P value = 0.0047.
Meaning that you would see a result this extreme, or more extreme, in either direction 0.47% of the time if politics and GDP performance were unrelated. P-values under 5% are generally considered to be strong statistical evidence of a correlation, values under 1% are considered to be very strong statistical evidence.
Last updated: September 8, 2015
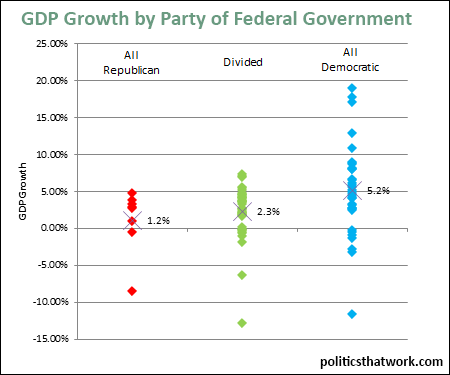
GDP Growth Since 1930 by Party Controlling Federal Government
Description: This graph plots the GDP growth of every year since 1930. The points in the "All Republican" column represent years in which the GOP controlled the presidency, and held majorities in both the U.S. House and the U.S. Senate. The "All Democratic" column indicates the same for the Democratic Party, and the "Divided" column includes years in which each party controlled at least one of those three institutions. The "X" in each column represents the average for the column.
Related blog post: Which Party Is Better for the Economy?Discussion: The U.S. has never had an especially strong economic performance, and has had some poor years and one disastrous year, when Republicans have controlled the federal government. However, the Republicans have only controlled entire federal government for a total of eight years, so one should be careful about being overly confident about the significance of that finding.
The difference between the years in which we have had divided government and the years in which the Democrats have controlled both houses of the legislature and the presidency is much more difficult to dismiss. We have had divided government during 41 years and Democratic control during 35 years. The statistical probability of this great of a difference, and a difference this consistent (detailed on the left) being a coincidence is very low.
There are many potential explanations for the differences in performance. The brinksmanship and gridlock that have characterized years of divided government are likely candidates, but given how dramatic the differences are, it seems impossible not to conclude that Democratic policy is simply better for the economy.
You can read more about how the economy fares under the parties by reading the blog post Which Party Is Better for the Economy? on this site, or by picking up a copy of Mike Kimel and Michael Kanell's book Presimetrics.See more graphs about: GDP


