Economic Record: President Bush Jr.
|
 |
||||||||||||||||||||||
President George W. Bush has the worst economic record of any president since Hoover. He holds the worst performance for GDP growth, stock market performance and job creation of any president of at least the most recent 11 presidents, and is near the bottom of the lists for all of the other measures below. Every President since Hoover, except Nixon, has left office with the stock market above where it started. Some presidents have seen the value of the stock market double or triple. President Bush, however, left office with the S&P 500 being worth 1/3 less than it was when he entered office. All of the measures below show roughly the same pattern: a slump at the start, average growth in the middle and a precipitous drop at the end. President Bush Jr. had two problematic events impact his economic record that were beyond his control. The first was that the United States was in an economic slump following the burst of the dot com bubble when President Bush took office. The second was the attacks by Al Qaeda on the World Trade Center. The two events combined to take the wind out of the sails of the economic engine that had powered the country forward so vigorously during President Clinton's presidency. However, he also initiated a number of significant policy changes that had far-reaching fiscal and economic consequences. Major economic events:
| |||||||||||||||||||||||
GDP | |||||||||||||||||||||||
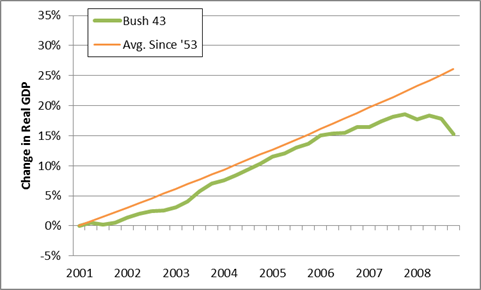 Related: Best Presidents for GDP growth Source: BEA Data: Excel | The green line represents the GDP growth during the presidency of President Bush Jr.. The orange line reflects
the average rate of GDP growth since 1953. The impact of the dot com bubble and the 9/11 attacks on the U.S.'s GDP growth was relatively modest. During Bush's presidency, the GDP generally grew at a roughly average pace until 2007 when it slowed and then crashed. | ||||||||||||||||||||||
| | |||||||||||||||||||||||
Job Creation | |||||||||||||||||||||||
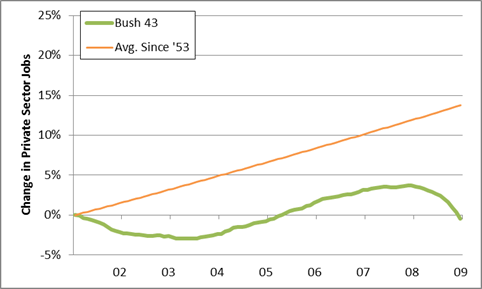 Related: Ranking the presidents for job creation Source: BLS Data: Excel | The green line represents the rate of the growth in the number of jobs under President George W. Bush. The orange line reflects
the average rate of growth in the number of jobs since 1953. President Bush has the worst record for private sector job creation of any president at least since WW2. He is the only post-WW2 president to have left the country with fewer people working than there were when he assumed office, despite having a larger population. | ||||||||||||||||||||||
Median Income | |||||||||||||||||||||||
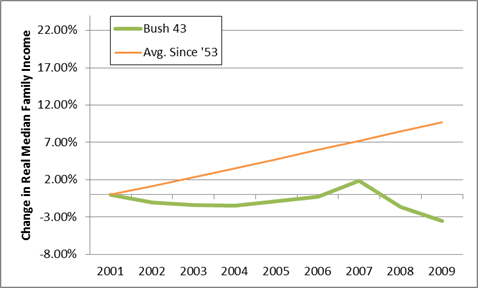 Related: Ranking the presidents for income growth Source: Census Data: Excel | The orange line is the rate at which the median family income has increased on average since 1953 and the
green line is how fast it increased under Bush Jr.. The median family income in the United States fared very poorly under President George W. Bush. The lackluster performance during his first term combined with the devastation of the Great Recession left the country's families with 3% less income at the end of his second term as they had at the start of his first term. | ||||||||||||||||||||||
| | |||||||||||||||||||||||
Debt as a Percentage of GDP | |||||||||||||||||||||||
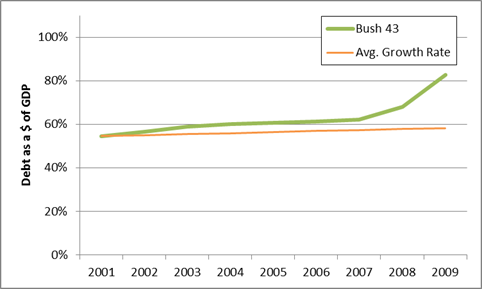 Related: Change in debt by president Source: BEA Treasury Data: Excel | This graph examines the way the debt shifted relative to GDP. The orange line shows
what the debt would have been if it had started at the same level as it was at when President Bush Jr. took
office and had grown at the average rate. The green line shows what actually happened. Starting in 2007, the United States experienced a perfect fiscal storm. Simultaneously fighting two wars created a major expense for the country and at the same time, the Bush tax cuts were sapping the treasury of revenues. The Great Recession both increased expenses and decreased revenues and and when combined with the tax cuts and wars, the United States plunged the country into debt, leaving George W. Bush with the worst record of any president since WW2 in terms of the ratio of debt to GDP. | ||||||||||||||||||||||
Stock Market | |||||||||||||||||||||||
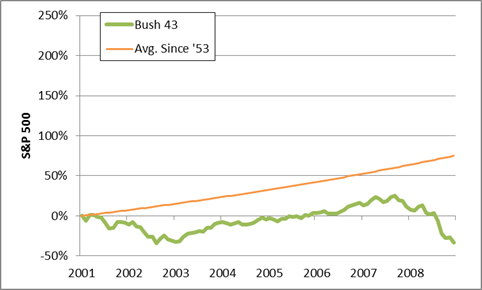 Related: Stock market performance by party of president Source: Yahoo Data: Excel | This graph compares the performance of the S&P500 under President Bush Jr. with the average. As noted above, Bush Jr. has by far the worst record for stock market performance. | ||||||||||||||||||||||
Compared to Other Developed Countries | |||||||||||||||||||||||
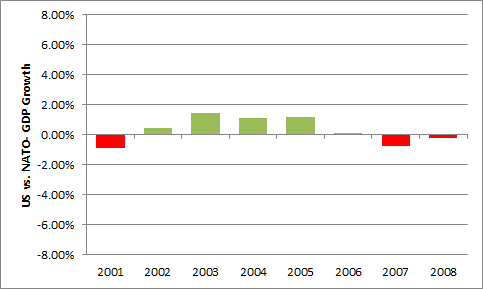 Related: Economic performance relative to NATO countries Source: USDA University of Groningen Data: Excel | This shows how the GDP growth of the United States compared to the GDP growth in the other original NATO member countries.
The other original NATO member countries are used as a benchmark because they have had relatively similar economic status to the
United States during the entire period examined. The U.S.'s economy generally performed roughly the same as the other original NATO members during the 43rd presidency. | ||||||||||||||||||||||
| Where President Obama turned the terrible economic hand he was dealt into a middling economic result, President George W. Bush turned a middling economic hand into a terrible economic result. His presidency was characterized by extreme fiscal irresponsibility at a time when there was no real economic rationale for it, by an escalation of trickle-down policies that sapped consumer spending and economic health, and by rampant deregulation that created dramatic economic risks. | |||||||||||||||||||||||
|
January 4, 2018 | |||||||||||||||||||||||
      | |||||||||||||||||||||||