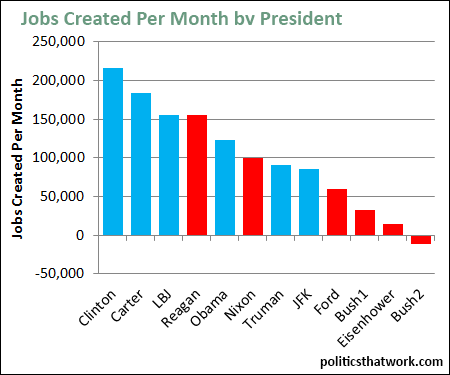
Best Presidencies for Job Creation
Description: This chart shows the average number of jobs created per month during each of the post-World War 2 presidencies. The figures used are the seasonally adjusted total number of people working in the private sector for the first full month during which each president was in office.
The data covers the period up to January of 2017.
Related blog post: Which Party Is Better for the Economy?Discussion: Six of the best eight presidencies, including the top three, were Democrats and all four of the worst four were Republicans.
FDR's presidency was not included because the BLS figures only go back to 1939, but it is clear that if he were included, his numbers would dwarf all the presidents listed.
It is noteworthy that President Carter has the second-best record for job creation.
The record of presidents for average GDP growth per year can be found here. These numbers also complement the findings of economist Steven Stoft regarding job creation during the modern presidencies.See more graphs about: Unemployment