Graph depicting Percentage of Social Spending Channeled through the Public Sector vs. Inequality
share on facebook
 
share on pinterest
 
share on twitter
 
share on reddit
 
share on tumblr
 
share on google+


< Previous Graph Next Graph >


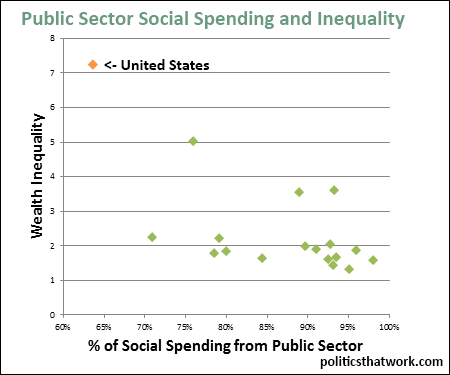
Description: Each dot represents a country in the OECD. The horizontal axis represents the percentage of social spending (largely education and health care) that is managed by the public sector. The vertical axis represents the degree of wealth inequality, measured as the ratio of the mean wealth to the median wealth. Put more simply, that is the the amount the average person's net wealth would be multiplied by if wealth were distributed evenly. The orange dot represents the United States.

Sources: OECD

Data: Excel

Last updated: March 16, 2016


Relying on the Private Sector for Social Spending Creates Inequality


Related blog post: Inequality in America

Discussion: Fixing inequality is not about spending more, it is about using different channels for our spending. Countries that pay for education and health care through their taxes rather than through insurance companies and student loans have radically less inequality. Often, those countries achieve that while spending less overall.

For example, the United States spends $14,738 per person on social spending. $9,375 of that is managed through the government, $5,363 is managed through the private sector. In the U.S., the median American would be worth more than seven times as much if wealth were split evenly. On the other hand, Finland spends $11,396 total, with nearly all of that being managed by the public sector. That means Finnish people pay roughly $2,000 more in taxes for social spending, but almost $5,000 less to insurance companies and student loans and so forth, for a net savings of around $3,000 per year per person. And, in Finland, the inequality is very low- the median Finn would only be worth 1.86 times as much if wealth were divided evenly.

While it is shocking to see how far the U.S. is out of the normal range, and how extreme the U.S.'s inequality is, the relationship between the percentage of social spending managed through the public sector and the level of inequality is not surprising. Social spending is the foundation of opportunity. Access to quality education in particular, but also health care and other social necessities, is a huge driver of the degree of economic success a person has. When social spending is managed by the government, the opportunity it creates is available relatively equally to all people, but when social spending is managed more by individuals, then the level of opportunity a child has is largely a function of how wealthy their parents are.


See more graphs about: Wealth   Inequality   Spending  


comments powered by Disqus