Graph depicting Clinton v. Trump Polling by News Source, College Education, Living in a City, Working
share on facebook
 
share on pinterest
 
share on twitter
 
share on reddit
 
share on tumblr
 
share on google+


< Previous Graph Next Graph >


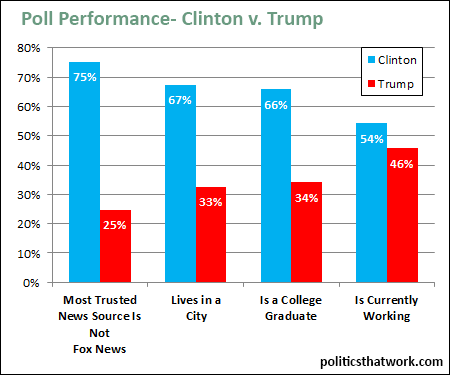
Description: Each column represents a subcategory of voters. The first category is voters who list any news source other than Fox as their most trusted news source. The second category shows how voters who live in cities split between the candidates. The third category shows how voters who have college degrees are voting. The fourth category shows how votes who are currently employed are planning to vote. In each case, the percentages shown are the percentages of voters who have decided who they are voting for.

Sources: Suffolk   CNN   Morning Consult

Data: Excel

Last updated: September 7, 2016


The Voters Are Splitting Along Different Lines in 2016


Discussion: 86% of voters who think that Fox News is the most trustworthy news source prefer Trump while voters who think any other news outlet is the most trustworthy favor Clinton 3 to 1. About 1/3 of voters identify Fox News as the most trustworthy news outlet. (Fox is actually the least trustworthy major news outlet.)

That does not necessarily mean that Fox is the cause of Trump's popularity. The opposite could also be true- that being inclined to support a candidate like Trump makes you find Fox more appealing than other sources of news. However, Fox does appear to be causing some of the recent shift towards the extreme right. Studies have found that watching Fox News makes a person more conservative and less informed. In any case, the relationship between watching Fox and supporting Trump is overwhelming. Looked at the other way, 64% of Trump supporters identify Fox News as the most trustworthy news source while only 9% of Clinton supporters do.

Living in a city also overwhelmingly corresponds to supporting Clinton. Suburban voters are roughly evenly split and 58% of rural voters prefer Trump.

College graduates are also far more likely to support Clinton than Trump. People with college degrees prefer Clinton almost 2 to 1. That is unprecedented in recent history. Although people in blue states tend to be more educated, President Obama only won college-educated voters by 2 points in 2012. Beating Trump by 32 points (and rising every time we check) among college graduates is astounding.

Lastly, voters who are currently employed prefer Clinton by 8 points while voters who are not currently employed prefer Trump by 2 points. Not being employed is not the same as being "unemployed." Most adults who aren't currently working are retired, in school or homemakers. However, the fact that being employed tends to correlate with stronger support for Clinton seems to cut against the "makers and takers" meme that the right is so fond of.

Some of the gaps noted here occur between Democrats and Republicans in general, but they are more extreme in this particular election. We also saw similar gaps between Trump and his Republican primary competitors.


See more graphs about: Polls  


comments powered by Disqus