Graph depicting Growth of Wealth in the United States by Bracket Between 1980 and 2012
share on facebook
 
share on pinterest
 
share on twitter
 
share on reddit
 
share on tumblr
 
share on google+


< Previous Graph Next Graph >


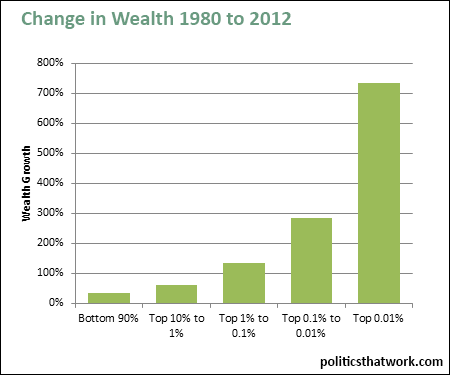
Sources: Saez and Zucman

Data: Excel

Last updated: March 16, 2016


Growth of Wealth in the United States by Bracket Between 1980 and 2012


Description: This chart shows the percentage by which the wealth of families in various tiers increased between 1980 and 2012 in real dollars. Note that this comparison is between the average wealth of the members of each tier. The membership of each tier would have changed during that time.

Related blog post: Inequality in America

Discussion: All the specified tiers saw their real net worth increase between 1980 and 2012. The average wealth of the bottom 90% increased by 34%- from $62,433 to $85,683. The average wealth of the next 9% increased 60% from $812,736 to $1.3 million. The average wealth of the bottom nine tenths of the wealthiest 1% increased 135% from $3.1 million to $7.2 million. The average wealth of the bottom nine tenths of the wealthiest 0.1% increased 285% from $10.3 million to $39.7 million. Lastly, the wealth of the wealthiest 0.01% increased an astounding 735% from an average of $44.4 million to an average of $371.2 million.

These numbers are the average wealth of the members of each bracket. In 2012, the top 1% bracket started with those who have a net worth of $3,964,000 or more. The top 0.1% starts at $20 million and the top 0.01% starts at $111 million.

This data is drawn from the data accompanying Emmanuel Saez and Gabriel Zucman's paper Wealth Inequality in the United States since 1913: Evidence from Capitalized Income Tax Data (2014) available at the link on the left.

This chart shows the change in each bracket's absolute real wealth. You can also see the change in each bracket's share of the nation's wealth here.


See more graphs about: Wealth   Inequality  


comments powered by Disqus