Blue States' Investments in Education Pay Off
      | |||||||
| One of the strongest arguments in favor of having independent states that are capable of
charting their own policy direction is that we can learn from their successes and failures and become stronger as a nation as a
whole by adopting those policies that work out the best. Justice Brandeis once described the states as "laboratories" in which
we could "try novel social and economic experiments." This is a compelling argument. One can imagine a country in which
we leverage this capability expertly to try out many different policies. The nation as a whole we could quickly migrate
to those policies that work out the best and away from those that work out the least well. We could be a country that learns
hard lessons and discovers new policy innovations 50 times as fast. But, that is not what we are doing. Instead, we have gone many decades in a row with half of the country pursuing a set of policies that is clearly not working out while the other half of the country pulls farther and farther ahead. For some reason, we do not seem to be learning the lessons from our failures or replicating our successes. The drastic differences in how the red and blue states fare has nothing to do with the people in them or the natural resources they possess or historical oddities. In many cases, blue states are radically outperforming red states that sit immediately next door, share the same populations, and have the same natural resources. The difference is policy. One example of a policy that gives Democratic state such an edge is investment in education. | |||||||
| 1. | Blue states invest much more in education | ||||||
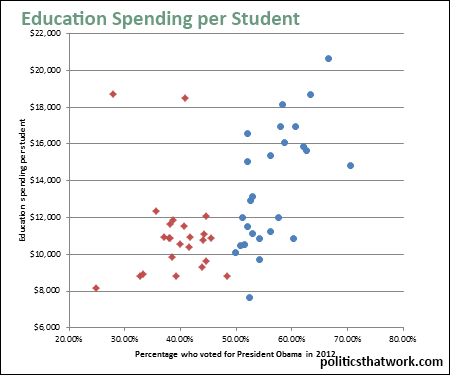 | |||||||
| This scatter graph correlates the amount that each state spends on K-12 education per student per year against
the percentage of the states' population that voted for President Obama in 2012. Spending on education is just one way that blue
states invest more heavily in their futures.
Blue states generally invest much more heavily in social welfare across the board. Those two red states way above the rest are Alaska and Wyoming in case you were wondering. | |||||||
| 2. | Investments in education result in better educated kids | ||||||
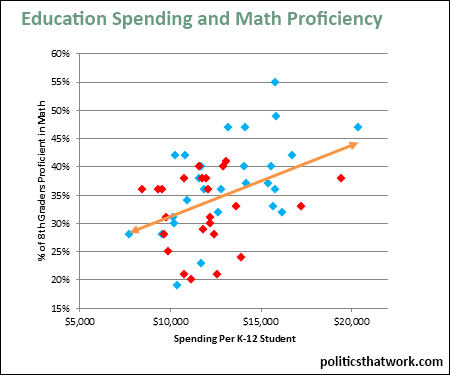 | |||||||
| This graph shows the results of strong investments in education. The verticle axis represents the percentage of eigth graders
in each state who pass the math proficiency test. The horizontal axis represents the amount that state spends on education per student. The
relationship is clear- the more a state spends on education, the more likely it is to have a lot of eighth graders that are good at math. As a result,
all the states that are excelling in math are Democratic.
| |||||||
| 3. | Better educated kids go further in school | ||||||
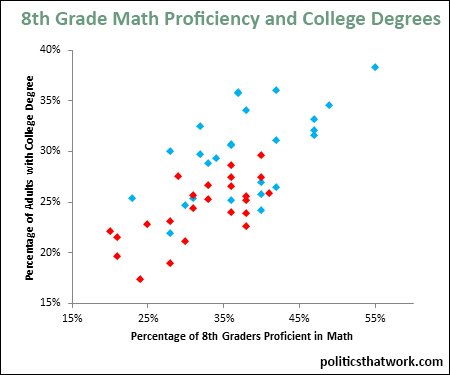 | |||||||
| The top 15 states with the largest percentage of the population having bachelor's degrees are blue.
Massachusetts tops the list with of its population 38% holding a bachelor's degree. The best red state for bachelor's degrees
is Kansas with 29% of its population holding bachelor's degrees. On the worst end of the spectrum, only 17% of the population of West Virginia has a bachelor's degree. These drastic variances in the number of college degree holders correlate dramatically with 8th grade math proficiency. On average, people in the states with the best 8th grade math results are 23% more likely to have a college degree. | |||||||
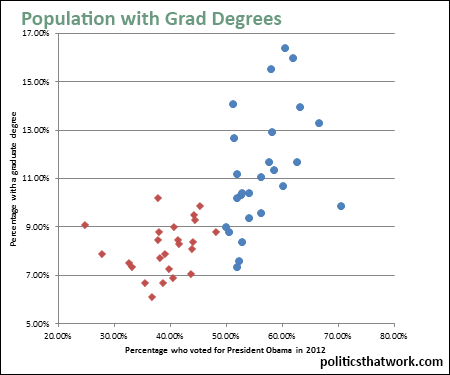 | |||||||
| The partisan gap is even more dramatic with regard to post graduate degrees (e.g., a master's degree,
PhD, law degree, medical degree, MBA, etc.). The 16 states in which the largest percentage of
the population has graduate degrees are all blue. Massachusetts again leads the pack with 16% of its population
holding a graduate degree and Arkansas has the fewest graduate degrees per capita at 6%. These are dramatic differences in the level of educational attainment. A person in the best educated states is 3 times as likely to have graduate degrees and more than twice as likely to have bachelor's degrees as a person in the least educated states. | |||||||
| 4. | An educated workforce is more innovative | ||||||
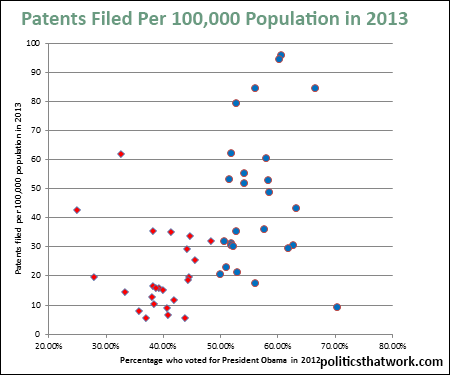 | |||||||
| This graph indicates the number of patents filed in 2013 per 100,000 population in each state. 13 of the top 14 states for patents filed
per capita are blue. Idaho is the highest ranking red state. That is something Idahoans should be proud of, but in fairness, it might also be a product
of the small sample size in a sparsely populated state Certainly, looking at patents alone might not give a comprehensive picture of the extent to which a state has entered the information economy. The National Science Foundation periodically publishes an exhaustive study of the extent to which states have embraced science and technology for example. Among the indicators tracked by that study is the percentage of individuals working in science and engineering occupations. Of the top 10, only one is red- Alaska. Of the bottom 10, only one is blue- Maine. Of course, STEM jobs are not the entirety, or even the main component, of information economy jobs, but that gives some indication. | |||||||
| 5. | States with a strong information economy prosper | ||||||
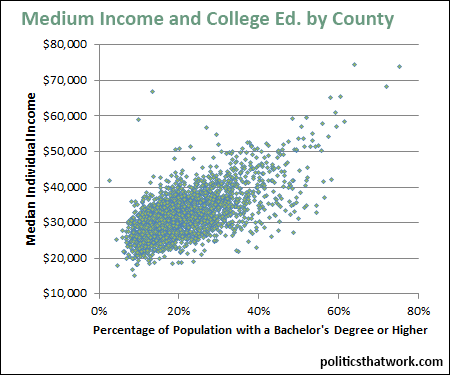 | |||||||
| This graph shows the median individual income of each county in the U.S. correlated against the percentage of that county's population that has a college degree.
This tendency for better-educated counties to have higher incomes largely explains the differences that we see between the incomes of red and blue states: | |||||||
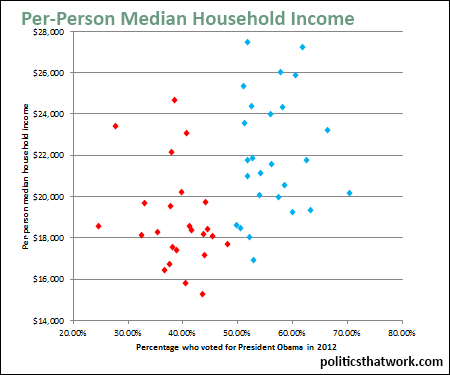 This graph indicates the per-person median household income. Note that this is the per-person figure, not the household figure. The
per-person figure is the median household income divided by the average household size in that state. So, it includes children. | The blue states have a per-person median household income approximately $4,000 a year higher than the red states. For a family of four, that would be $16,000 a year. Only 5 of the top 25 states are red- North Dakota, Wyoming, Alaska, Nebraska and South Dakota. The highest state (New Hampshire) has a per-person household income $12,000 higher than the lowest state (Mississippi). For a family of four, that would be $48,000 per year. That we see this dramatic of a gap in incomes is not surprising given the data above. The median person with a college degree earns $23,764 more per year than the median person with a high school diploma and the median person with a professional degree (e.g., law degree or medical degree) earns $55,276 more each year than a person with a high school diploma does. The larger numbers of well educated people in the blue states pushes the median incomes of the blue and red states far apart. In short, all of the differences discussed above make a huge difference. The cumulative results are stark, not just in financial terms, but in more personal terms. For example, consider how drastically the average lifespans differ between red and blue states. September 25, 2014 Updated: March 21, 2015 | ||||||