Which Party Is Better for the Economy?
      | |
There are several ways one can go about determining which party's policies tend to perform better economically. One option is to look at what economists say. Another is to look at how the economy has performed during times when one party has had more power and compare that to how the economy has performed in the same place during times when the other party has had more power. A third way is to look at how the economy performs in places where one party tends to have more power compared to how the economy performs in places where the other party has more power. All three approaches have their advantages and disadvantages, but by weighing all three, one can potentially get a pretty decisive answer. Opinions of economistsThere are many different ways to assess the consensus of economists on policy issues. Much of the public believes that economists tend to be libertarian and to favor laissez faire economic policy. That idea- that economic wisdom favors leaving all things to the free market- is actually dead wrong. Economists generally tend to support policies at least as liberal as the policies the Democratic Party supports. Some examples:
• 71% of economists favor using government to
redistribute wealth and only 8% strongly
oppose it. In fact, the concept of the
diminishing marginal utility of wealth is a very well established and non-controversial
economic principle. Even Adam Smith expressed the view that the government should redistribute wealth.
• Only 12% of economists take the view that the costs of the stimulus outweighed the benefits- a view passionately held by nearly all Republicans. • 75% of economists favor government tuning the economy with monetary policy- an idea often vehemently rejected by the Republican Party- while only 4% of economists strongly oppose it. • Zero percent- not a single economist in the entire sample- of economists agree with the central tenant of Republican fiscal policy that cutting tax rates would boost the economy enough to cause revenues to increase. • 94% of economists support taking action to address climate change. In terms of specific policies, economists appear to consistently and overwhelmingly either support the Democrats' policies or to be to the left of the Democrats. This stance on policy issues unsurprisingly translates into which party economists support: Democratic economists outnumber Republican economists by 2.5 to 1. In 2012, economists felt that President Obama had a better grasp of economics than Mitt Romney by a margin of almost 2-to-1 and that President Obama would grow the economy faster than Mitt Romney by a a margin of 20 points Comparing results between red and blue statesWe have 50 different states, each with its own set of policies. In many cases, states have adhered to a generally consistent approach to policy for decades or even a century or more, so the condition the states are in is a strong indicator of the effects those policies have. This presents a great opportunity to evaluate the impacts of those policies by comparing the economies of the states.The most straight-forward way to see whether the economy is performing better in red states or blue states is simply to look at the per-person median household income. The differences in that regard are stark: 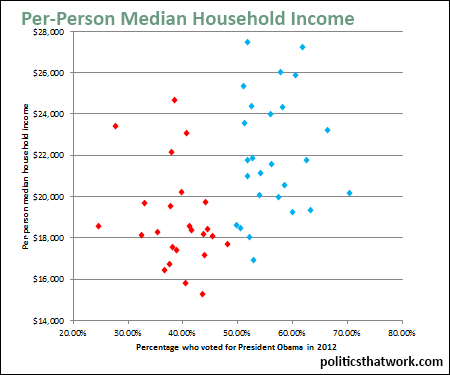
(click on any graph for more detail and the source data) You can see equally stark results by looking at the states ranked from highest to lowest for median household income. Another way to measure which states are doing well economically is to look at the percentage of people in poverty. The results are the reverse of the results above for median income: 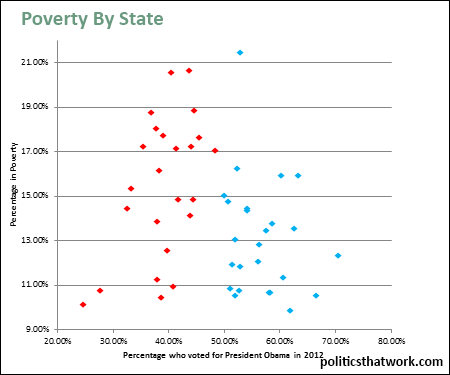 The success of the Democratic states seems to play out across the board, even beyond the economic realm, as is evidenced by the consistently stronger performance of the Democratic states in terms of standard of living. In fact, even lifespans differ dramatically between red and blue states. It seems clear that liberal policies are performing better at the state level across the board. I posted some ideas about why Democratic states are doing so much better economically earlier, but for our purposes here all that matters is that they are in fact doing so much better. Comparing performance between Republican and Democratic yearsThe performance gap we see at the state level could still theoretically be the result of factors other than policy. It could be that the red states have simply drawn the short straws and happen to have inferior access to natural resources or trade or that they simply lost out in the lottery of history. That seems unlikely because states that are very different in every other way still tend to perform similarly to states with which they share little other than policy, but it is still a possibility. So, to eliminate the possibility that the differences are the product of localized factors, next we want to see how the policies of the parties perform when we hold the locality constant and look instead at years when each party was in power.The most fundamental measure of economic performance is the rate at which the gross domestic product (GDP) grows. At the national level, the differences between how fast our GDP has grown during years when the Democrats have controlled both the legislature and the presidency, how fast it has grown when the Republicans controlled both, and years when the parties have split control are as follows: 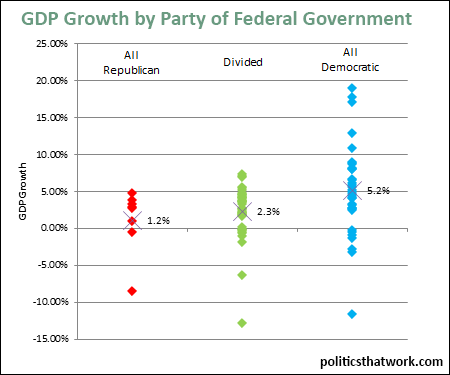 The parties' records for stock market performance vary even more dramatically: 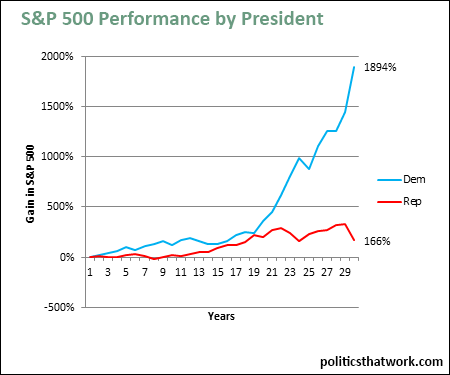 But, GDP and stock market performance are not everything. It is always possible for the size of the economy and the value of the market to grow without actually benefiting the average American much if the wealth is overly concentrated in the pockets of the very rich. The U.S. certainly does have a major problem with overconcentration of wealth. So, we should also look at some indicators that measure how typical Americans are doing. One obvious measure is the unemployment rate: 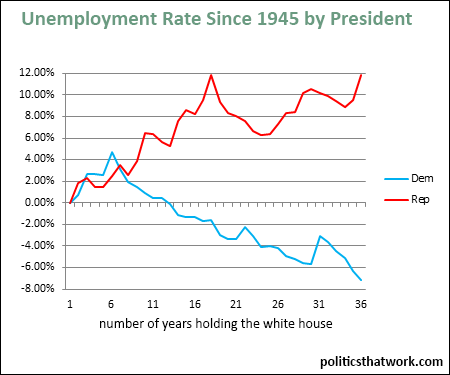 Some would argue that the unemployment rate is not a reliable measure because the labor force participation rate can mask big changes in the employment situation. However, we can dispatch with that concern by looking at job creation: 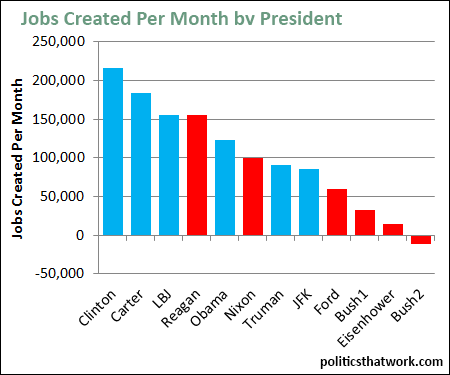 That result certainly is dramatic. But, still, if, for example, the number of jobs fell under Republicans and grew under Democrats, but wages did the opposite, that might not be as strong of an endorsement for Democrats as it first seems. Or, if taxes shoot up so much under Democrats that it swamps the gains for most Americans, that would weaken the Democrats' case as well. The way to see if either of those problems is occurring is to look at how much personal income Americans are getting after taxes: 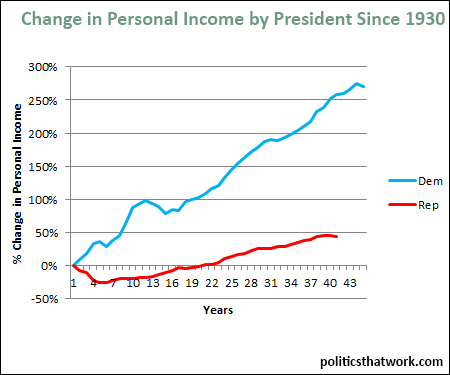 One final way you can compare how the parties perform economically is by looking at how the U.S. performed relative to how the economies of other developed countries performed during the same time span: 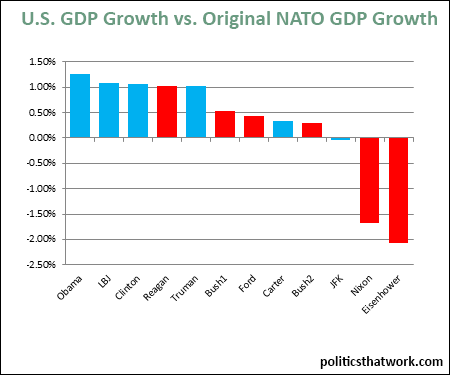 Again, we see the Democrats outperforming the Republicans. At this point, some of you might be thinking "sure, they're better for the economy, but what about the debt they rack up?" You may be surprised to learn that Democrats generally tend to outperform Republicans on the debt as well. You see similar results when you look at how states that have tried out both parties have performed under each. For example, Florida's GDP has grown twice as much under Democratic governors as it has under Republican governors since 1970, despite the Republicans having had more years to accumulate growth. Minnesota's GDP has grown two and a half times as much during the most recent 12 years under Democrats as it has under Republicans and its unemployment rate has fallen 9 percent under Democrats since 1977 and risen by 7 percent under Republican governors. No matter how one looks at the data- by relying on the findings of economists, by looking at state level or looking a federal data, and no matter which economic measure one looks at, the answer is the same: Democratic policies are performing better. And not just a little better- drastically better. Any of these measures standing alone could simply be a coincidence. For example, even if policy was not related to economic performance at all, we would still see results that differ as dramatically as they differ in the GDP chart above approximately 1 out of every 200 times. However, when you add up all of this data, the odds of it happening purely due to bad luck are for all practical purposes zero. You can learn a lot more about how the parties' economic records stack up by picking up a copy of Mike Kimel and Michael Kanell's book Presimetrics. April 14, 2015 | |
| |