Inequality in America
      | |
This article aims to paint a very high level picture of the nature of inequality in the United States, how it has changed in the past 35 years, what some of the underlying phenomena are and how we stack up against other countries in terms of the way we distribute wealth and income here. Increasingly unequal distribution of incomeThe U.S. economy has not grown as quickly over the last 35 years as it did over the decades before that, but it has still grown dramatically. Our real GDP, in 2009 dollars, has grown from $28,775 to $51,042 per person since 1980: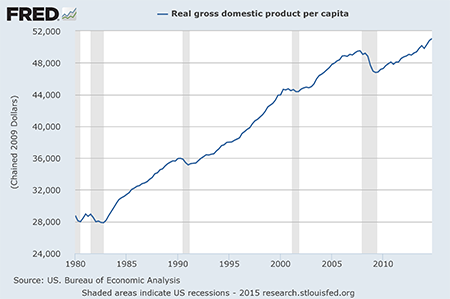
(click on any graph for more detail and the source data) One might assume that would mean that Americans are earning almost twice as much today as they were in 1980. However, it has not played out that way. In fact, only the top 10% of the country have experienced any income growth at all while the bottom 90% of us have actually seen our incomes fall 5%: 
To be clear, the chart above represents the percentage by which our incomes have increased, not the absolute amount. If we had experienced the same amount of economic growth, but the shares everybody was receiving had remained constant, all of the brackets would have experienced the same percentage increase, even though the incomes of the top brackets would have increased by a dramatically larger absolute amount- the top bracket's income would have increased by millions and the bottom 90%'s income would have increased by thousands, but the percentages would be the same, so the bars would have been the same height. As a result of the capture of all of our economic growth by the top 10% (and, disproportionately, the top 0.1%), we have seen the overall picture of how our nation's productivity is divided up shift dramatically: 
90% of us went from dividing up 2/3 of the income to dividing up 1/2 of the nation's income between us. It is important to note that even in 1980, income in the United States was already distributed in a highly unequal manner. The average person in the top 0.01% was already making 175 times as much income as the average person in the bottom 90%. Today, the average person in the top 0.01% makes 789 times as much as the average person in the bottom 90%. One way to wrap your head around what this all means is to look at what incomes would be if the distribution of income had remained the same as it was in 1980: 
Effect of income inequality on wealthAs dramatic as the changes in the distribution of income have been, the changes in the distribution of wealth have been even more dramatic. This occurs because while lower brackets have to spend most of their income (and hence save only a small portion), the top brackets are free to save nearly all of their income. As a result, the wealth of the top 0.01% has increased by more than twice the percentage that their share of the income has increased:
The average person in the top 0.01% (the richest one out of every 10,000 of us) now has a mind boggling $371 million in wealth- 4,436 times as much wealth as the average person in the bottom 90%. As a result, the share of our nation's wealth owned by the bottom 90% of us has dropped from just under 1/3rd to just over 1/5th. Today, 1 person in every 1,000 owns approximately as much as 900 of those 1,000 people combined. In 1980, even the combined wealth of the 10 richest people out of 1,000 was only 2/3 as much as the combined wealth of the bottom 900 people: 
Division of productivityOne of the central factors in determining how a society's income and wealth are distributed is how highly labor is valued relative to capital. Capital tends to come disproportionately from a smaller set of people while labor tends to come from a much larger number of people, and while one individual can have a million times as much capital as another, one individual cannot have more hours in the day than another person, so economic schemes that favor investors over employees tend to increase inequality.One way to measure how well labor is being rewarded is to look at wages as a fraction of productivity. Productivity is the revenue each worker creates minus the cost of material inputs into the company. Productivity has been steadily increasing in proportion with the GDP growth above, but the portion of that productivity that makes its way into the pockets of the employees has been dropping steadily: 
The gap between productivity and the pre-tax wages shown above is made up by two categories- the cost of benefits and the share of productivity that the employer keeps. Both have been steadily increasing as the share that workers get has fallen. The average American worker produces $66 in value for every hour they work. That $66 is divided up as follows: 
PoliticsInequality has increased during both Democratic and Republican presidencies since 1980. President Clinton in some ways followed the economic path set by the Republican presidents that preceded him. The top 1/5th of the country fared dramatically better than the median American under both parties. However, the incomes of all quintiles fared significantly better under Democratic presidents than they have under Republican presidents. All income growth under Republican presidents occurred in the top 40% of the population while the bottom 60% lost income under Republicans. Under Democrats, the incomes of all quintiles increased and the distribution of the growth among the bottom 80% was more evenly distributed:
(Note for the meticulous observer who noticed that these numbers don't look like they would add up to the numbers in the second chart of the article: these are self reported household income numbers and the second chart is family income numbers from tax filings.) Comparison to other developed nationsAt this point in the analysis, you might be thinking that increasing inequality is just a necessary part of economic growth. One might imagine that economic growth always tends to benefit the wealthy disproportionately and so conclude that wealthy societies necessarily have high degrees of inequality. However, that is not the case. In fact, the U.S. is quite unusual for having both high inequality and high income:
No other country in the OECD with a median income of over $4,000 has as much inequality as the U.S. does and all of the countries with higher median incomes than the U.S. has have dramatically less inequality. While this article does not attempt to explore the potential causes of income inequality, one correlation is too stark to ignore when looking at how the U.S. compares to other developed nations- the robustness of the safety net. Countries that dedicate a larger portion of their GDP to public social spending tend to have far less inequality: 
In the U.S., we tend to think of public safety net spending as an added expense. But, that is not quite right. Public safety net spending is really a substitute for private social spending. If we pay $1,000 more in taxes to get more public health care, and that cuts our insurance bill by $1,000, then we did not actually spend any more. What differentiates the U.S. from the countries that dedicate more of their GDP to public social spending is not actually how much is spent on that type of services. In fact, the U.S. spends significantly more on social welfare than other developed countries, due in large part to the high cost of medical care in the U.S. The difference is that the mechanism many of the other developed countries use is public where the U.S. uses private mechanisms, such as insurance companies. It is shifting from private mechanisms for funding social welfare to public mechanisms that appears to lower inequality. You can learn much, much more about economic inequality by picking up any or all of the following books: Thomas Piketty's Capital, Joseph Stiglitz's The Price of Inequality and David Cay Johnston's Divided: The Perils of Our Growing Inequality. February 22, 2015 | |
 | |