Economic Record: President Obama
|
 |
||||||||||||||||||||||||||||||||||
The most significant economic event during President Obama's presidency was, without a doubt, been the Great Recession. When he took office, the country was losing hundreds of thousands of jobs a month, the stock market was in freefall and the GDP was shrinking. Several of the measures below show the country pulling out of this recession during the first 6 to 18 months of his presidency and then performing well above average performance after that point. In many cases, his overall average performance is impacted significantly by the first initial months. Given that caveat, during President Obama's presidency, the economy performed worse than average for GDP growth, job creation, median income and debt. However, the performance of the stock market was spectacular. It is also important to put the economic performance in global context. During President Obama's presidency, the United States' GDP growth beat the GDP growth of the other original NATO member countries by the widest margin of any president since World War II. Major economic events:
| |||||||||||||||||||||||||||||||||||
GDP | |||||||||||||||||||||||||||||||||||
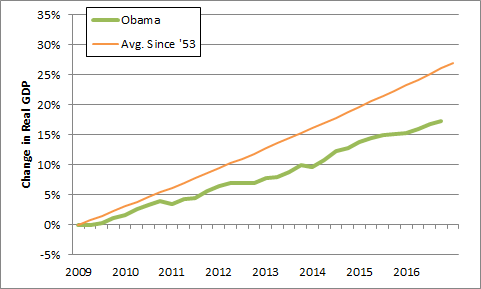 Related: Best Presidents for GDP growth Source: BEA Data: Excel | The green line represents the GDP growth during the presidency of President Obama. The orange line reflects
the average rate of GDP growth since 1953. GDP growth was below-average during Obama's presidency. That said, it was right about dead on average for years in which we have had divided control of the federal government | ||||||||||||||||||||||||||||||||||
| | |||||||||||||||||||||||||||||||||||
Job Creation | |||||||||||||||||||||||||||||||||||
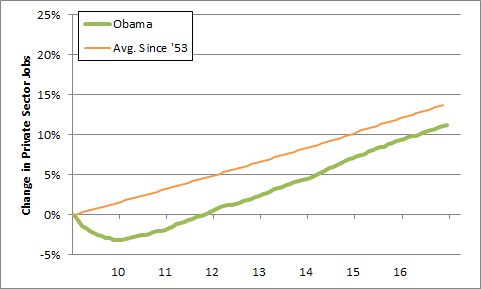 Related: Ranking the presidents for job creation Source: BLS Data: Excel | The green line represents the rate of the growth in the number of jobs under President Barack Obama. The orange line reflects
the average rate of growth in the number of jobs since 1953. The economy lost jobs every month of 2009, albeit at a steadily slowing rate. The economy gained jobs every month after February of 2010. Including 2009, the United States has added an average of 127,824 jobs per month during Obama's presidency, which places him fifth for job creation since FDR. However, excluding 2009, the average would be 191,747 per month, which would rank him second, and from 2011 to the present, we have averaged 207,429 per month, which would place President Obama just behind President Clinton for first place. | ||||||||||||||||||||||||||||||||||
Median Income | |||||||||||||||||||||||||||||||||||
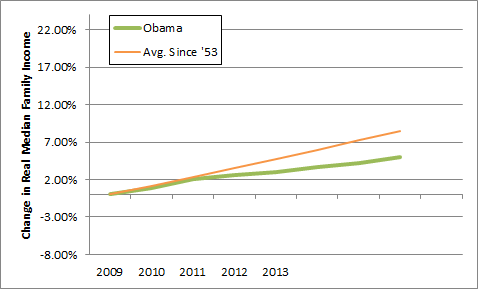 Related: Ranking the presidents for income growth Source: Census Data: Excel | The orange line is the rate at which the median family income has increased on average since 1953 and the
green line is how fast it increased under Obama. The median income grew at a slightly slower pace during Obama's presidency than it has historically. That being said, incomes have been growing more slowly for decades. | ||||||||||||||||||||||||||||||||||
| | |||||||||||||||||||||||||||||||||||
Debt as a Percentage of GDP | |||||||||||||||||||||||||||||||||||
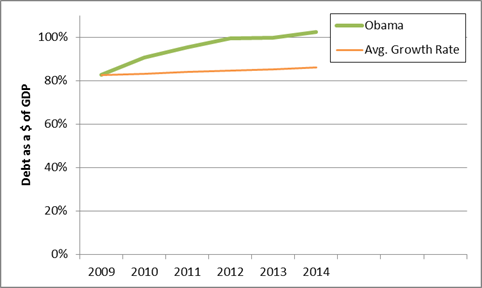 Related: Change in debt by president Source: BEA Treasury Data: Excel | This graph examines the way the debt shifted relative to GDP. The orange line shows
what the debt would have been if it had started at the same level as it was at when President Obama took
office and had grown at the average rate. The green line shows what actually happened. President Obama has the second-worst record on the debt since 1953. The federal government ran the largest deficit, in absolute terms, it has ever run in 2009: $1.4 trillion. The primary causes of the large deficit were the Great Recession, two simultaneous wars, the Bush tax cuts and the stimulus spending. The stimulus spending is generally seen by economists as having been a net positive for the economy, and it is a large part of the reason that the United States' economy is now dramatically outperforming the economies of other developed countries, as discussed below. By fiscal year 2014, the deficit had been reduced to a manageable $483 billion. | ||||||||||||||||||||||||||||||||||
Stock Market | |||||||||||||||||||||||||||||||||||
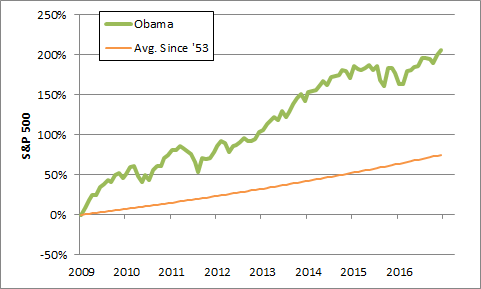 Related: Stock market performance by party of president Source: Yahoo Data: Excel | This graph compares the performance of the S&P500 under President Obama with the average. The stock market performed remarkably during Obama's presidency and more than tripled in value. The rate at which the stock market increased in value roughly matches the rate at which it increased during the first six years of Clinton's presidency, but the bursting of the dot com bubble at the end of Clinton's presidency erased any gains after Clinton's sixth year.President Obama has the best record of any president in modern history. | ||||||||||||||||||||||||||||||||||
Compared to Other Developed Countries | |||||||||||||||||||||||||||||||||||
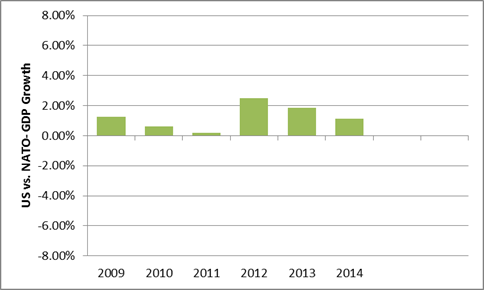 Related: Economic performance relative to NATO countries Source: USDA University of Groningen Data: Excel | This shows how the GDP growth of the United States compared to the GDP growth in the other original NATO member countries.
The other original NATO member countries are used as a benchmark because they have had relatively similar economic status to the
United States during the entire period examined. The U.S. economy grew faster than the other original NATO members by a wider margin under President Obama than any other president in modern history. This is typically attributed to the U.S.'s decision to stimulate the economy in 2009 rather than implementing austerity measures as the other original NATO member countries did. | ||||||||||||||||||||||||||||||||||
| Overall, President Obama managed to turn the terrible economic hand he was dealt into a mixed economic record. In some areas, the economy performed remarkably, while in other areas, the performance was disappointing. Many of the challenges President Obama faced are common to the entire developed world and the United States has certainly fared far better than the other developed nations. However, that has come at the expense of adding to the national debt, and the gains have generally been concentrated in the hands of those who need them the least. In addition to the challenges imposed by the global economic climate, President Obama faced extraordinary opposition by the Republicans in the legislature. Many of the acts of congressional Republicans, such as forcing the sequester, bringing the country to the brink of default twice,shutting down the government and blocking a wide variety of legislation designed to minimize the risks posed by the financial sector or to create jobs, have caused harm to the economy and prevented the economy from healing as quickly as would be desireable. However, despite these hurdles, the economy has performed passably overall and thus far, has performed quite well during President Obama's second term. | |||||||||||||||||||||||||||||||||||
|
January 4, 2018 | |||||||||||||||||||||||||||||||||||
      | |||||||||||||||||||||||||||||||||||