Graph depicting U.S. GDP Growth Relative to Original NATO Members
share on facebook
 
share on pinterest
 
share on twitter
 
share on reddit
 
share on tumblr
 
share on google+


< Previous Graph Next Graph >


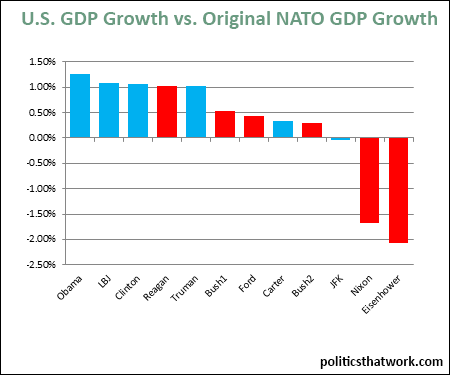
Description: This graph shows how the U.S.'s GDP growth compares to the GDP growth of the other original NATO members. A bar at the 0% line with no height would reflect that the average GDP growth during that president's term was exactly the same as the average GDP growth of the other original NATO members. Bars above the zero line indicate that the U.S.'s gross domestic product grew more rapidly than the gross domestic products of the other original NATO members. For example, if the U.S.'s GDP grew 4% and the other NATO countries' GDP grew 3%, the graph would show 1%. Likewise, bars below the zero line indicate that the GDP of the other NATO countries grew faster than the U.S.'s GDP.

The original NATO members are the United States, Canada, Belgium, Luxembourg, Denmark, France, Iceland, Italy, the Netherlands, Norway, Portugal and the United Kingdom.

Sources: USDA ERS   University of Groningen

Data: Excel

Last updated: April 14, 2015


Under Obama, the U.S.'s GDP is Growing Faster than Other Original NATO Members by the Widest Margin Since FDR


Related blog post: Which Party Is Better for the Economy?

Discussion: The GDP growth of the United States has beaten the other NATO countries by a wider margin under President Obama than it has under any previous president since FDR. Democrats have generally performed much better than Republicans. During the average year in which we have had a Democratic president, our GDP has grown 0.89% more than the other original NATO countries' GDP and during the average Republican year, it has grown 0.36% less than the other NATO countries.

There are a number of theories as to why our GDP has been growing so much faster under President Obama than the GDPs of the European Union countries. One clear difference is that the United States adopted a stimulus approach to the recession while the EU implemented strict austerity policies. Generally speaking, economists believe that government spending should be counter cyclical- meaning that we should spend more during recessions and less during booms. So, that might explain the more rapid recovery in the United States.

It is important to consider the U.S.'s economic performance in light of the global economy because it eliminates many external factors beyond the control of U.S. policy that could skew the records of the presidents in either direction. For example, during a year of global recession, simply preventing GDP from falling would be a massive success and during a global boom, what would be respectable GDP growth during other years might actually reflect terrible economic policy.

The reason that the original NATO member countries are used as the point of comparison is that they have generally been the most similarly situated to the United States. The OECD or the G20 are other possible comparisons, but they both contain countries that have had far different economic histories during this time period, such as China and Russia. The original NATO countries have all been developed capitalist economies for the entire time period.


See more graphs about: GDP  


comments powered by Disqus