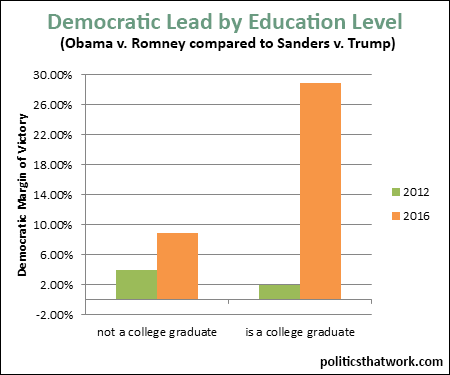


Description: The green bars represent the margin of Obama's victory over Romney in 2012 for non-college graduates and college graduates. The orange bars indicate the margin Sanders has over Trump in the polls among non-graduates and graduates. The orange bar shows the percentage of decided voters.
Sources: CNN 2012 exit polls Quinnipiac Poll 3/23
Data: Excel
Last updated: March 26, 2016