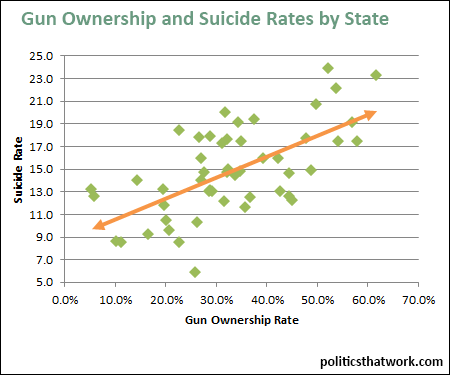
Gun Ownership Rates and Suicide Rates
Description: The horizontal axis represents the percentage of the states' adult population who own a gun. The vertical axis represents the number of suicides per year, per 100,000 population. The orange line is the trend line, which shows the average influence each variable has on the other.
Discussion: The states with the highest levels of gun ownership have approximately twice as many suicides as the states with the lowest levels of gun ownership.
The relationship appears to be driven by two primary factors. First, people with a gun in the household are more likely to attempt suicide because they have the means readily available where many people in households without guns have to seek a means to end their life and may rethink the decision before acquiring those means. Second, suicide attempts with a firearm are far more likely to result in death than the other most common means.
The three states with the highest suicide rates are Montana, Alaska and Wyoming, which have gun ownership rates of 52%, 62% and 54% respectively. The three states with the lowest suicide rates are the District of Columbia, Massachusetts and New Jersey, which have gun ownership rates of 26%, 23% and 11% respectively.
Note that the states with the highest and lowest suicide rates also tend to be among the highest and lowest for gun death rates generally.See more graphs about: Guns