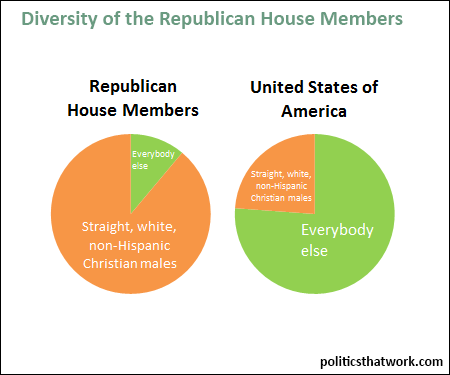


Description: The pie chart on the left presents the percentage of the Republican members of the U.S. House of Representatives who are white, male, non-Hispanic and Christian. The pie chart on the right presents the percentage of the population of the United States that is white, male, non-Hispanic and Christian.
Sources: CRS Pew Census
Last updated: January 28, 2015