Graph depicting Income Growth Under Republicans and Democrats- Bottom 90%
share on facebook
 
share on pinterest
 
share on twitter
 
share on reddit
 
share on tumblr
 
share on google+


< Previous Graph Next Graph >


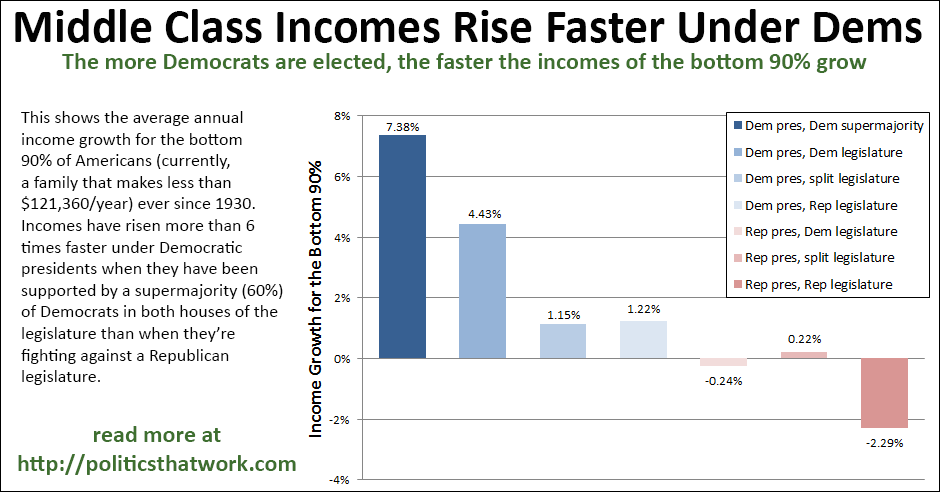
The Bottom 90% of Americans' Incomes Grow Much Faster Under Democrats


Description: Each bar shows the average change in the incomes of the bottom 90% of U.S. families when each party has controlled the presidency, controlled both houses of the legislature and when control of the houses of the legislature have been split. The data looks at all years since 1930.

The graph also includes a column representing the average income growth during years when the Democrats have controlled both the White House and at least 60% of each house of the legislature. Republicans have not held 60% of both houses since 1930. Note that the column representing years when the Democrats have controlled a majority in the legislature also includes the years when the Democrats controlled a supermajority, as that is also a majority.

Sources: Senate   House   Library of Congress   Emmanuel Saez

Data: Excel

Last updated: March 26, 2016

 
Discussion: When Democrats control both houses of the legislature and the presidency simultaneously, the incomes of the bottom 90% of Americans have grown 4.43% per year on average. When Republicans have been in the same situation, the incomes of the bottom 90% of Americans have, on average, fallen by 2.29% per year.

When control is split between the parties, which party controls the presidency appears to have an impact on the middle class. However, whether they party that holds the presidency controls one or neither of the legislative houses during a split year does not seem to have a significant impact on the incomes of the bottom 90%.

Interestingly, the bottom 90% does starkly better when the Democrats control not just a majority in each house of the legislature, but at least 60% in each house. This could be in part the result of the ability of the Democrats to overcome filibusters in the Senate, although the filibuster rules still required the Senator to actively stand and speak during the filibuster for many of those years, and the filibuster was less of a hurdle under those rules.

More likely, it reflects the fact that a bare majority can only pass legislation when it maintains perfect party unity. Often times, the majority party is still required to compromise with the minority party in that situation because a handful of legislators in precarious elections can be pealed off by the minority party. A party that holds a comfortable buffer can more easily implement its policies despite losing a few moderate or vulnerable members.

The incomes of the top 10% correlate less clearly to the political party in control. The incomes of the top 10% still grow fastest when the Democrats have a supermajority (4.11%) and fall when the Republicans hold both the presidency and the legislature (-0.43%), but, unlike the bottom 90%, they do quite well when control is split. For example, they gain 3% per year when we have a Democratic President with a Republican legislature and 2.92% when we have a Republican President and a split legislature.

The economy in general also performs much better under Democratic leadership.


See more graphs about: Income   Inequality  


comments powered by Disqus