Graph depicting Probability of Being the Victim of a Hate Crime
share on facebook
 
share on pinterest
 
share on twitter
 
share on reddit
 
share on tumblr
 
share on google+


< Previous Graph Next Graph >


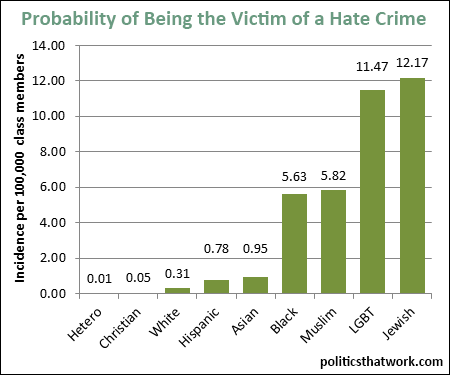
Description: This graph shows the number of incidents of hate crimes per 100,000 members of the group that was targeted in 2013. In short, it shows the odds that a member of that group will be the victim of a hate crime based on the group they are a member of each year. Note that a person could fall in more then one of these groups, in which case their odds would be based on the total of the relevant columns.

Sources: FBI   Census   Pew   Gallup

Data: Excel

Last updated: November 4, 2015


Probability of Being the Victim of a Hate Crime


Discussion: A black person is 18 times more likely to be the victim of a racially-based hate crime than a white person is. In 2013, there were 2,371 racially-motivated hate crimes against black people reported to law enforcement and 754 against white people, but because there are more white people, the odds for a given white person are much lower. Hispanic and Asian people are 2-3 times as likely as white, non-Hispanic, people to be the victim of a racially motivated hate crime.

Jewish people are more than twice as likely to be the victim of a religiously-motivated hate crime than Muslims and 243 times more likely than Christians.

Gay, lesbian, bisexual and transgender people are 1,639 times more likely to be the victim of a hate crime based on sexual orientation or gender identity than heterosexual people are. Note, of course, that a transgender person can be both LGBT and heterosexual.

Most hate crimes are either vandalism or assault. Mercifully, there were only 5 hate crime murders in 2013. One was anti-white, one was anti-black, one was anti-Hispanic and two were anti-LGBT. However, there were 2,454 hate crime assaults. The most common bias-motivations for assaults were anti-black (766) and anti-LGBT (734).

These stats show the numbers reported to law enforcement. The actual number incidents for all of the columns is presumably higher as not all incidents are reported.


See more graphs about: Diversity  


comments powered by Disqus