The Longer You Stay in Schools, the Higher Your Lifetime Earnings
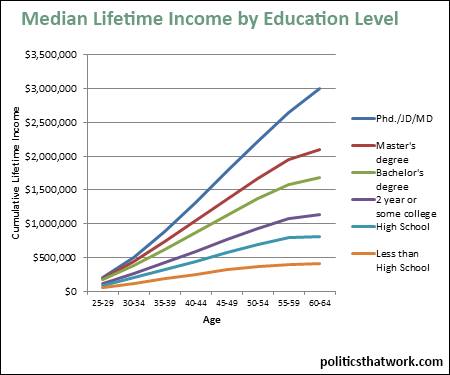
Description: This graph shows the median cumulative lifetime earnings of people by age, depending on their level of educational attainment. The lines are broken out between people with a Phd. or professional degree (law degree or medical degree), master's degree, bachelor's degree, some college or an associate's degree, high school diploma and less than a high school diploma. The income amount shown is the cumulative total for their entire life, by the time they have reached that age. The data includes all people with those degrees, not just those who are working.
Related blog post: Blue States' Investments in Education Pay OffDiscussion: Although it seems to be questioned more and more often as of late, it remains undeniably true that education is an extremely sound investment. At every level of educational attainment, advancing to the next level will increase your lifetime income- even given the lost years of working- by much more than that additional education costs.
Of course, that does not mean that every person should get a Phd. These figures show the median income of people holding each level of educational attainment. Some people start a program and do not finish it. Also, half of people who get each of these types of degrees make less than is shown on the graph. To hit these numbers, a person needs to perform as well as the average person who attains that degree. So, the simple answer is that a person should stick with education for so far as they believe they could perform at least as well as the average person who has the next degree up the chain.
It is also important to note that this graph does not show the total contribution to the economy of education. This is only the portion of that contribution that is captured by the individual as wages. The total benefit to the economy is roughly double this amount.See more graphs about: Education