Graph depicting Welfare Spending and the Poverty Rate by State
share on facebook
 
share on pinterest
 
share on twitter
 
share on reddit
 
share on tumblr
 
share on google+


< Previous Graph Next Graph >


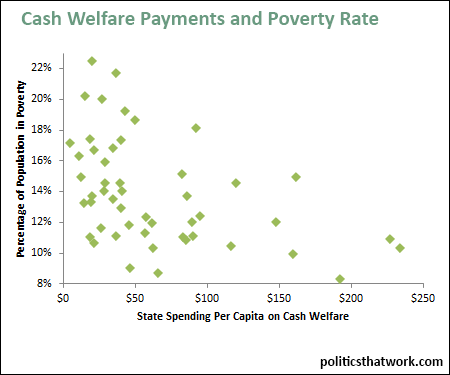
Description: This graph shows the relationship between the amount states spend on cash welfare programs per capita and the poverty rate. Cash welfare payments include state contributions to SSI, TANF and Medicare and also various state programs that provide cash benefits to people in poverty. The amount spent is per resident of the state, not per recipient.

Sources: Census   Census

Data: Excel

Last updated: October 4, 2015


States that Are More Generous With Cash Welfare Have Less Poverty


Discussion: The correlation between high cash welfare benefits and low poverty is very strong. Some of the states with very low poverty rates also spend very little on welfare. For example, New Hampshire spends less than $50 per capita on cash welfare benefits, but has a poverty rate of only 9%. However, all of the states that have high poverty rates spend little on welfare. This is consistent with the possibility that there are multiple factors that can lead to low poverty rates, but that high welfare spending is one of them. For example, New Hampshire spends little on cash welfare benefits, but spends a great deal on education and the result is a low poverty rate, but other states have achieved a low poverty rate by spending a lot on welfare, but very little on education (for example, Utah).

It is a common belief on the right that welfare benefits, and especially cash welfare benefits, create dependency and hence ultimately increase poverty. The data clearly disproves that premise. If welfare spending increased poverty, the states that provide the most generous benefits would have higher pre-transfer poverty rates rather than the lower rates we see.

The conclusion to draw might be that states with low poverty rates do not necessarily need to increase cash welfare spending, but states with high poverty rates almost certainly would see those poverty rates decrease dramatically if they began spending more on welfare.

It is also important to note that to some extent, lifting people out of poverty pays for itself. The poverty rate is calculated based on a pre-tax, pre-welfare benefit, basis. That means that as more people rise out of poverty, they make more income and hence pay more in taxes, which offsets the cost of lifting them out of poverty.


See more graphs about: Poverty   Spending  


comments powered by Disqus