Graph depicting Tax Rates During the Best Years for Economic Growth
share on facebook
 
share on pinterest
 
share on twitter
 
share on reddit
 
share on tumblr
 
share on google+


< Previous Graph Next Graph >


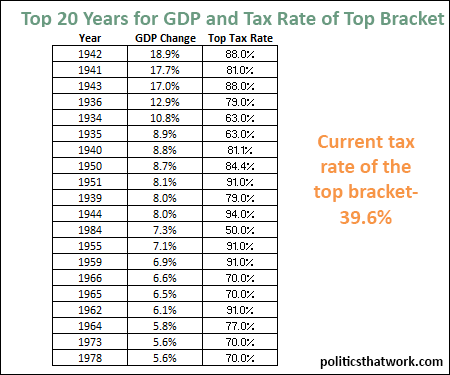
Description: The top 20 years for GDP growth since 1930 and the marginal tax rate for the top individual income tax bracket. Note that only 1984 had a top tax rate of less than 60%.

Sources: BEA   Tax Policy Center

Last updated: January 28, 2015


Top 20 Years For GDP and Tax Rate of Top Bracket


Discussion: The tax rate for the top income tax bracket was much higher than it is today for most of modern history and economic growth was generally faster when it was quite a bit higher than it is today.

However, it is important to note that the marginal rate for the top income tax bracket is not a perfect measure of the tax burden of the rich. A better measure would compare the effective tax rate on all types of income for the rich. Unfortunately, that data is not available going back very many years, so we need to live with a rough approximation. Luckily, the top tax rate has generally tended to rise and fall roughly along with the capital gains rate and the estate tax, and to have an inverse relationship to the number of deductions and loopholes the rich take advantage of. When the politicians have been inclined to reduce the taxes of the rich, they have typically reduced them in all of those ways and vice versa.

Of course, high taxes on the rich (or any bracket) does not in and of itself increase economic growth. Taking money out of the economy in the form of taxation always slows economic growth. But, raising tax revenues allows the government to spend, which always boosts economic growth, and the data does suggest that a dollar in government spending tends to do more good for the economy than a dollar in income for the rich. It is, however, possible that the relationship is not causal at all and that the high tax rates are a response to economic growth rather than a cause. But, at the very least, the data proves beyond a doubt that much higher taxes on the rich than we have today can be compatible with much faster economic growth than we have today.


See more graphs about: Taxes   GDP  


comments powered by Disqus