Graph depicting State Taxes and Poverty
share on facebook
 
share on pinterest
 
share on twitter
 
share on reddit
 
share on tumblr
 
share on google+


< Previous Graph Next Graph >


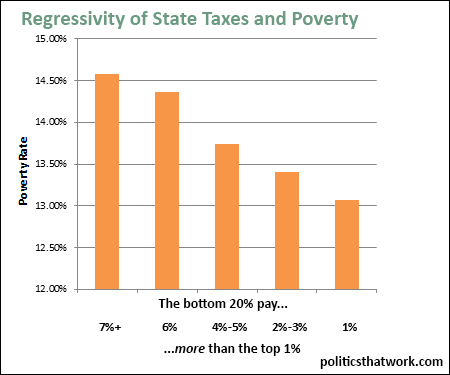
Description: This chart shows the percentage of the populations of states that are in poverty grouped by how regressive each states' taxes are. In the states in the left column, people in the bottom 20% for income pay between 7% and 14.4% more of their income to state and local taxes than the people in the top 1% do. In the states in the second column from the left, people in the bottom 20% pay between 6% and 6.99% more than the people in the top 1%. And so on.

Sources: ITEP   Census

Data: Excel

Last updated: January 29, 2015


More Regressive State Taxes Mean More Poverty


Discussion: Perhaps surprisingly, every state's tax system is regressive. Even in the least regressive state (Delaware), the people in the bottom 20% pay more of their income to taxes than the people in the top 1% do (5.5% vs. 4.8% for Delaware). In the most regressive state (Washington state), people in the bottom 20% pay 16.8% of their income to state taxes while people in the top 1% pay only 2.4%.

Unsurprisingly, the states with more regressive tax systems tend to have more of their population stuck in poverty. It is important to note that the correlation is not overwhelming. There are some states with very few people in poverty and some states with many people living in poverty in each of the brackets. However, the pattern made by the averages is clear- the states with the most regressive tax systems have, on average, 1.5% more of their population stuck in poverty than the states with the least regressive tax systems.

The reason that regressive taxation correlates with poverty is obvious- the more money the poor have to spend on taxes, the less money they have to invest in things like education, transportation, computers, child rearing, and so forth to get themselves or their children out of poverty. Furthermore, the less the rich pitch in to keep the foundations of their states strong, the less opportunities there are for the poor to lift themselves out of poverty.

It is also important to note that liberal politics do not always materialize as less regressive taxation, nor do conservative politics always seem to lead to more regressive taxes. Both the most regressive state and the least regressive state are blue and each party has states among both the five most regressive and the five least regressive states.


See more graphs about: Taxes   Poverty  


comments powered by Disqus