Graph depicting Belief that Humans Cause Climate Change and Educational Attainment
share on facebook
 
share on pinterest
 
share on twitter
 
share on reddit
 
share on tumblr
 
share on google+


< Previous Graph Next Graph >


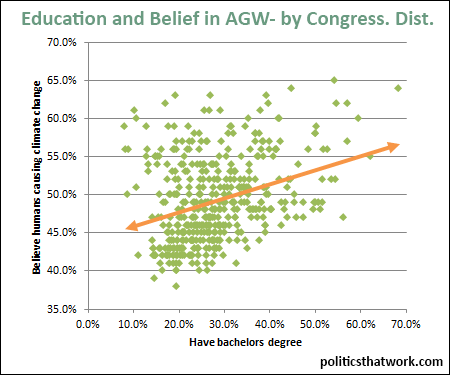
Description: This graph shows the correlation between the level of acceptance of the scientific consensus that human activity is the primary cause of recent climate change and the percentage of the population that has attained a bachelor's degree or higher. Each dot represents a federal congressional district and the orange trend line indicates the average variation in acceptance of AGW as the level of education rises.

Sources: Census   Yale

Data: Excel

Last updated: November 19, 2015


The More Educated a Congressional District Is, the More Strongly it Accepts AGW


Discussion: The more highly educated the people in a congressional district are, the higher the percentage of its population accept the scientific consensus position on human's role in climate change. Less educated districts are split between accepting man-made climate change and denying it, but tend to deny it. Highly educated districts all have relatively high levels of acceptance of climate science.

This simplest explanation is that more educated people are more likely to be aware of scientific consensus and also more able to understand the science, and hence are more likely to agree with the scientific consensus. Another factor is likely that blue states tend to be more highly educated and the rejection of climate science is largely driven by conservative pundits and politicians. A third possible explanation is that lower income areas tend to have higher carbon emissions. To the extent that low income correlates with low levels of education, it could also be the case that the less educated areas are simply more reliant on fossil fuels and hence less likely to come to terms with the problems such fuels cause. The drag on policy created by the low education districts has a pretty profound effect. Even the COP21 Paris pledges being proposed are insufficient.


See more graphs about: Environment   Education  


comments powered by Disqus