Graph depicting Unemployment by Party of President
share on facebook
 
share on pinterest
 
share on twitter
 
share on reddit
 
share on tumblr
 
share on google+


< Previous Graph Next Graph >


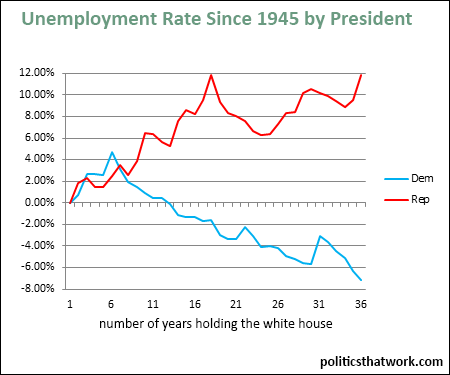
Description: This chart compares the change in the unemployment rate under Democratic Presidents to the change under Republican Presidents since 1945. The results are cumulative, as if the intervening years did not occur, but are not compounded.

Sources: BLS

Data: Excel

Last updated: November 26, 2015


Change in Unemployment Rate by Party of President- Since 1945


Related blog post: Which Political Party Has Created More Jobs?

Discussion: Each party has held the presidency for the same number of years since 1945. During those years, the unemployment rate has risen 11.8% under Republican presidents and has fallen 7.2% under Democratic presidents. Unemployment has fallen during the overwhelming majority of Democratic years since 1949. Unemployment rose steadily under Republicans up until 1982, then fell during the remaining Reagan years, and then rose again under both Bush Presidents.

The stark gap between the performance of the parties on unemployment may be surprising to many people. But, it really should not. Unemployment has dropped dramatically under both Presidents Clinton and Obama and rose drastically under President Bush Jr.

The years at the start when unemployment rose under a Democrat was the years that we were coming out of WW2. A common response from the right to data regarding unemployment is that the Democrats are simply putting huge numbers of people on the government payroll, running up a lot of debt. That, however, is incorrect. In fact, private sector job creation numbers actually tend to look better for Democrat than the overall job creation numbers. And, in any event, the numbers of federal employees are too few to have an impact this major in either direction. Democratic presidents have also tended to do much better than Republican presidents in terms of the debt.

For more information on why this happens, you might want to read the blog post here on which party is better for the economy, or if you really want to dig deeply into the issue, you might be interested in Mike Kimel and Michael Kanell's book Presimetrics.


See more graphs about: Unemployment  


comments powered by Disqus