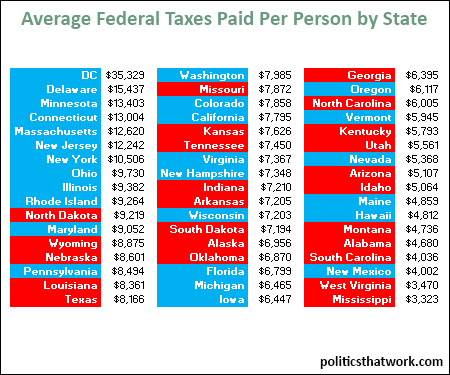
Average Federal Taxes Paid Per Person
Description: This table lists the average individual federal tax liability per person (not per taxpayer) by state. Blue rows indicate states which supported President Obama in 2012 and red rows indicate states which supported Mitt Romney in 2012. All federal taxes paid by individuals, including FICA, capital gains, income and the estate tax, are included.
Discussion: The 10 states that pay the most federal taxes per person are all blue. Residents of the District of Columbia pay more than 10 times as much in federal taxes each year as residents of Mississippi do. DC is, however, a dramatic exception because it is entirely made up of a thriving urban center. However, residents of each of the top 10 states pay 3-5 times as much in federal taxes as residents of Mississippi.
The average resident of a blue state pays $9,438 in federal taxes while the average resident of a red state pays $6,591.
The amount of federal taxes paid minus federal spending received, per person by state can be found here.See more graphs about: Taxes